

Down 3-2 to the Rockets in the Western Conference finals, the Warriors won back-to-back games to punch their ticket to the NBA Finals for the fourth consecutive season. The Rockets pushed them in ways we’ve only ever seen twice before, but Golden State’s four All-Stars carried them to victory once again, with Stephen Curry and Kevin Durant leading the charge in a historic Game 7 on the road.
Before they take on LeBron James and the Cavaliers in Game 1 of the NBA Finals on Thursday, here are five stats you need to know from the Warriors’ series win over the Rockets.
29.8: The Warriors’ net rating in the second half
The Warriors scored at a rate of 124.6 points per 100 possessions in the second halves of their Western Conference finals series with the Rockets and held Houston to 94.8. It was a remarkable difference from the first halves — the Warriors had a net rating of -5.7 points per 100 possessions (99.7 offensive rating, 105.4 defensive rating).
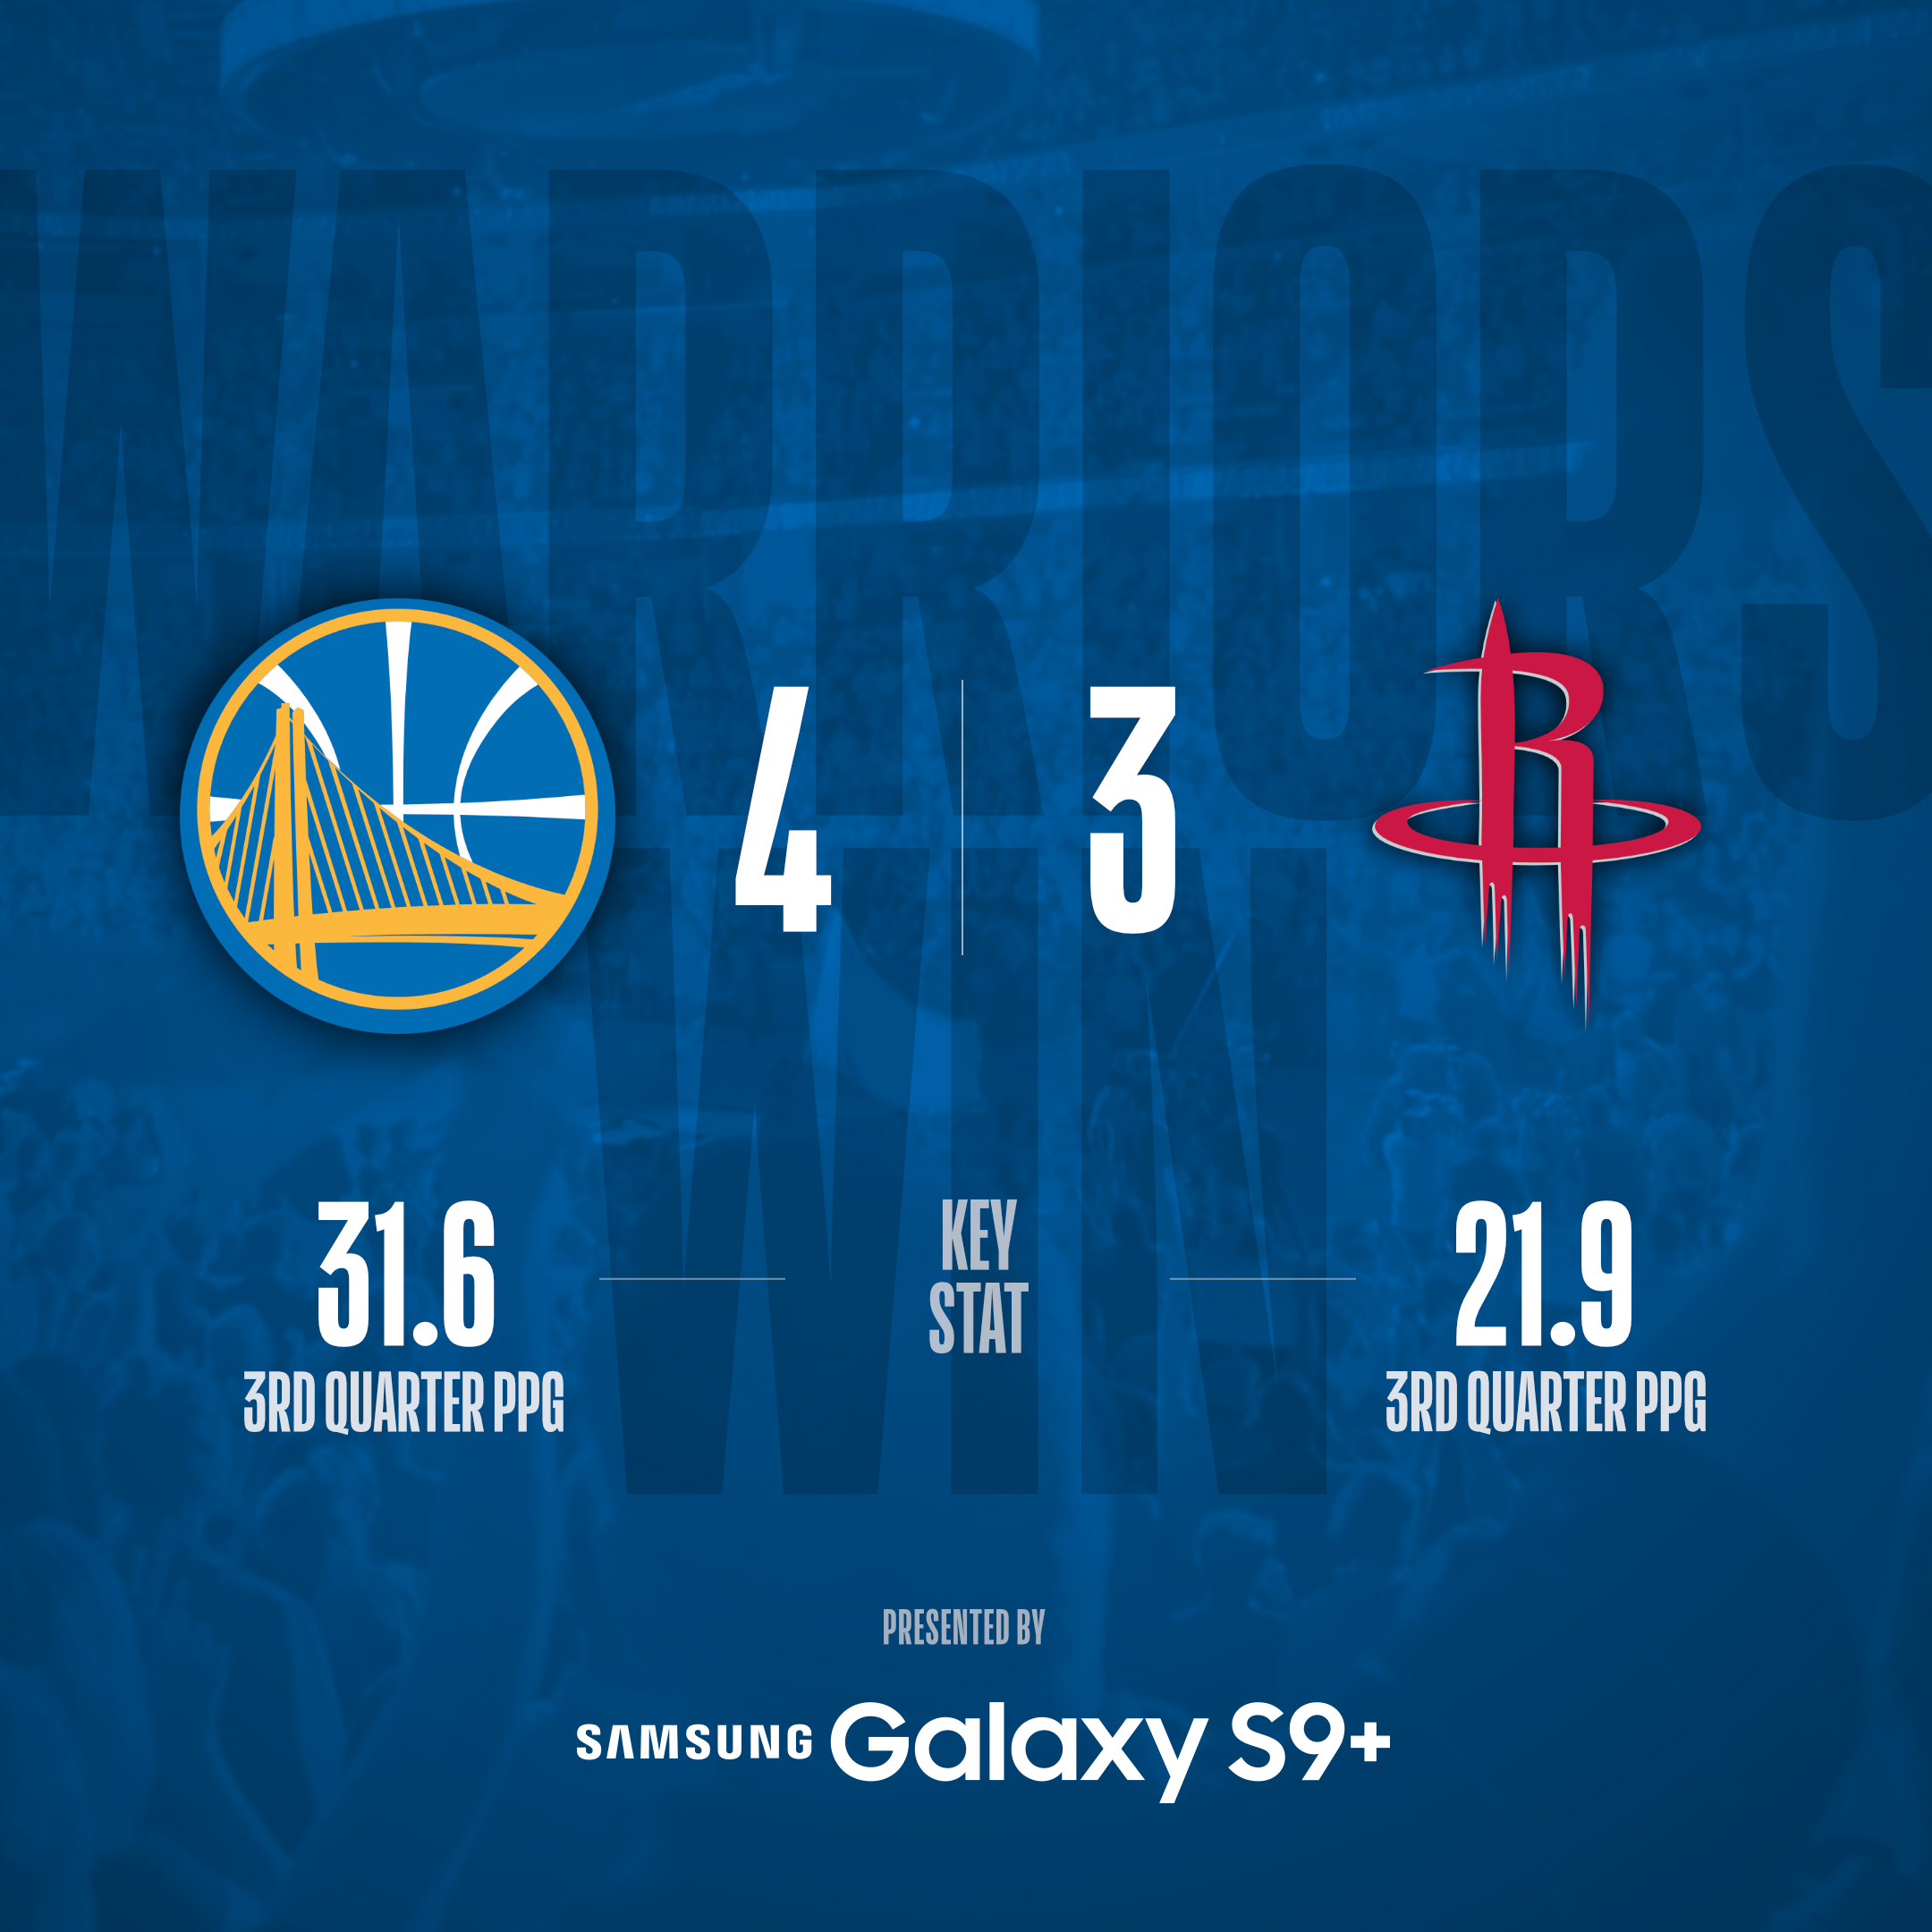
Much like the second round, the Warriors did most of that damage in the third quarter. Curry and Durant paved the way in those minutes, combining to score 20.6 points on 59.8 percent shooting from the field, 53.8 percent from the 3-point line and 90.5 percent from the free throw line. The Rockets were able to bounce back from Golden State’s third-quarter onslaught in Game 4, but they otherwise had no answer, which ended up determining the series.
13.2: How many points Chris Paul averaged in the second half
The biggest reason the Rockets had no answer for the Warriors in Games 6 and 7 was because they were without Chris Paul, their nine-time All-Star who suffered a hamstring injury in the closing seconds of their Game 5 victory. While James Harden set the tone for the Rockets in the first halves of the series, it was Paul who took over in the second halves.
| Player | 1st Half vs. Warriors | 2nd Half vs. Warriors |
| Chris Paul | 6.6 PPG on 29.7% FG, 31.6% 3PT, 62.5% FT | 13.2 PPG on 49.0% FG, 42.1% 3PT, 83.3% FT |
| James Harden | 17.1 PPG on 41.9% FG, 31.8% 3PT, 87.5% FT | 11.6 PPG on 40.8% FG, 14.7% 3PT, 90.0% FT |
Rockets head coach Mike D’Antoni talked about how much they missed Paul following their Game 7 loss. Eric Gordon, who started in place of Paul for the final two games of the series, did as well, though he took it a step further by saying the Rockets would be playing on Thursday (Game 1 of the NBA Finals) had Paul been healthy.
Based on the last two numbers, Gordon had reason to believe that would’ve been the case.
29.9: The Rockets’ 3-point percentage in losses
It was particularly bad in Game 7, when the Rockets shot 7-for-44 as a team from the 3-point line. They started the game making six of their first 14 attempts from distance, only to miss 27 consecutive 3-pointers between the midpoint of the second quarter and the midpoint of the fourth quarter, when the Warriors outscored them 58-34.
According to Chris Herring of FiveThirtyEight, the Rockets “embarked on an approximately 1-in-72,000 cold spell from deep at the worst possible time,” with Harden going 0-for-9, Gordon 0-for-7, Trevor Ariza 0-for-6, P.J. Tucker 0-for-2, Gerald Green 0-for-1 and Joe Johnson 0-for-1 during that stretch.
12.1: The Warriors’ turnover rate in wins
The Warriors went from averaging 17.7 assists and 16.3 turnovers per game in their three losses to the Rockets to 23.8 assists and 11.5 turnovers per game in their four wins. Whereas the former was a testament to Houston’s defense — they successfully baited Durant into playing isolation basketball for much of the series — the latter points to how difficult the Warriors are to keep up with when they share the ball.
It’s why assists and turnovers are two of the three stats Warriors head coach Steve Kerr looks at after every game. When the Warriors share the ball efficiently rather than rely on the individual brilliance of their stars, they’re practically unstoppable.
7.4: How many free throws James Harden averaged per game
Harden gets to the free throw line more than anyone else in the NBA. The last person to make and attempt more free throws than the Rockets star was Durant, who led the league in both categories during the 2013-14 season.
No team, however, keeps Harden off the free throw line as well as the Warriors do. After averaging only 3.0 free throw attempts per game against Golden State during the regular season — less than any other team in the league — Harden attempted 7.4 free throws per game in the Western Conference finals, down from 7.6 in the first round of these playoffs and 8.6 in the second round. It was the difference between free throws making up 28.5 percent and 22.9 percent of his overall scoring.
Seven players scored a greater percentage of their points at the charity stripe than Harden in the conference finals, the most notable being Durant (25.4 percent). Harden often got the better of Golden State’s big men on switches, but they rarely committed the types of fouls Harden usually draws in those situations.